我們在學校的學習,大致上會需要買(或找)書、讀書、考試以及看成績,機器學習的概念也與之非常相似,但我們會稱之為收集資料、訓練模型、測試模型和效果評估,並且為了將資料轉換成機器方便運算的格式,通常還會在收集資料與訓練模型之間,加上一個叫做特徵抽取的步驟。以下將大略的介紹從收集資料到效果評估的相關概念,更多細節會在後面的應用章節提及。
Our learning in school generally involves buying (or finding) books, studying, taking exams, and checking grades. The concept of machine learning is very similar, but we call these steps data collection, model training, model testing, and performance evaluation. In order to convert the data into a format that is easy for machines to process, a step called feature extraction is usually added between data collection and model training. Below is a brief introduction to the concepts from data collection to performance evaluation. More details will be covered in later chapters on applications.
我們以「使用身高體重分辨生理性別」作為一個範例的研究題目來說明。為了這個題目,你首先可能需要找一堆人,然後測量他們的身高體重以及紀錄性別,這就是收集資料以及特徵抽取(feature extraction)。而如果已經有人公開提供資料,例如這裡,你也可以在符合授權條款的情況下,用這些資料來做實驗。需要注意的是,特徵抽取並不是隨便亂抽就可以,例如:
We will use "distinguishing biological sex based on height and weight" as an example research topic for illustration. For this topic, you might first need to find a group of people, then measure their height and weight and record their sex. This is data collection and feature extraction. If someone has already made data publicly available, such as here, you can also use this data for your experiments, as long as you comply with the license terms. Note that feature extraction cannot be done arbitrarily. For example:
- 兩性平均的體脂率不一樣,因此體脂率可能是個有幫助的特徵
- 手臂長度跟身高很相關,但由於我們已經有身高當作特徵了,所以手臂長度的幫助可能沒那麼大
- 性聯遺傳疾病中,雖然不同疾病在不同性別的發病率可能有明顯的不同,但是若你的資料中剛好相關個案的數量非常少,則對整體模型效果的幫助通常也不大
- 至於像是鼻孔有幾個或是腿有幾條,這種除非遭遇疾病或意外否則不會有差異的值,就幾乎不太可能有幫助
- Average body fat percentage differs between the two sexes, so body fat percentage may be a helpful feature
- Arm length is highly correlated with height, but since we already have height as a feature, arm length may not add much additional help
- For sex-linked genetic diseases, although the incidence rate of different diseases may vary noticeably between sexes, if your data happens to contain very few related cases, this usually does not help the overall model performance much either
- As for values such as the number of nostrils or the number of legs, which generally do not vary unless due to disease or accident, these are almost never helpful
接著,我們會把資料分成三個子集,分別為訓練集(training set),驗證集(validation set) ,以及測試集(test set);其中,驗證集又稱開發集(development set),而在初步實驗等狀況下,也有可能不特別切出驗證集。三份資料集的說明如下:
Next, we will split the data into three subsets: the training set, the validation set, and the test set. Among these, the validation set is also called the development set. In cases such as preliminary experiments, it is also possible not to specifically split out a validation set. The three subsets are explained below:
- 訓練的概念相當於你平時的讀書學習,也就是使用一堆你知道答案的資料來學出模型。
- 驗證的意思則相當於模擬考,讓你有機會在發現考得不夠好的時候,回頭調整模型的訓練。
- 測試則是當作讀完書後上去真正的考場,也就是把從測試集抽取出的特徵輸入進訓練好的模型,再把模型的輸出跟答案來比對分數。
- Training is similar to your usual studying, that is, using a bunch of data for which you already know the answers to learn a model.
- Validation is similar to a mock exam, giving you the chance to go back and adjust your model training when you find the results are not good enough.
- Testing is like taking the actual exam after finishing your studying, that is, feeding the features extracted from the test set into the trained model, then comparing the model's output with the correct answers to obtain a score.
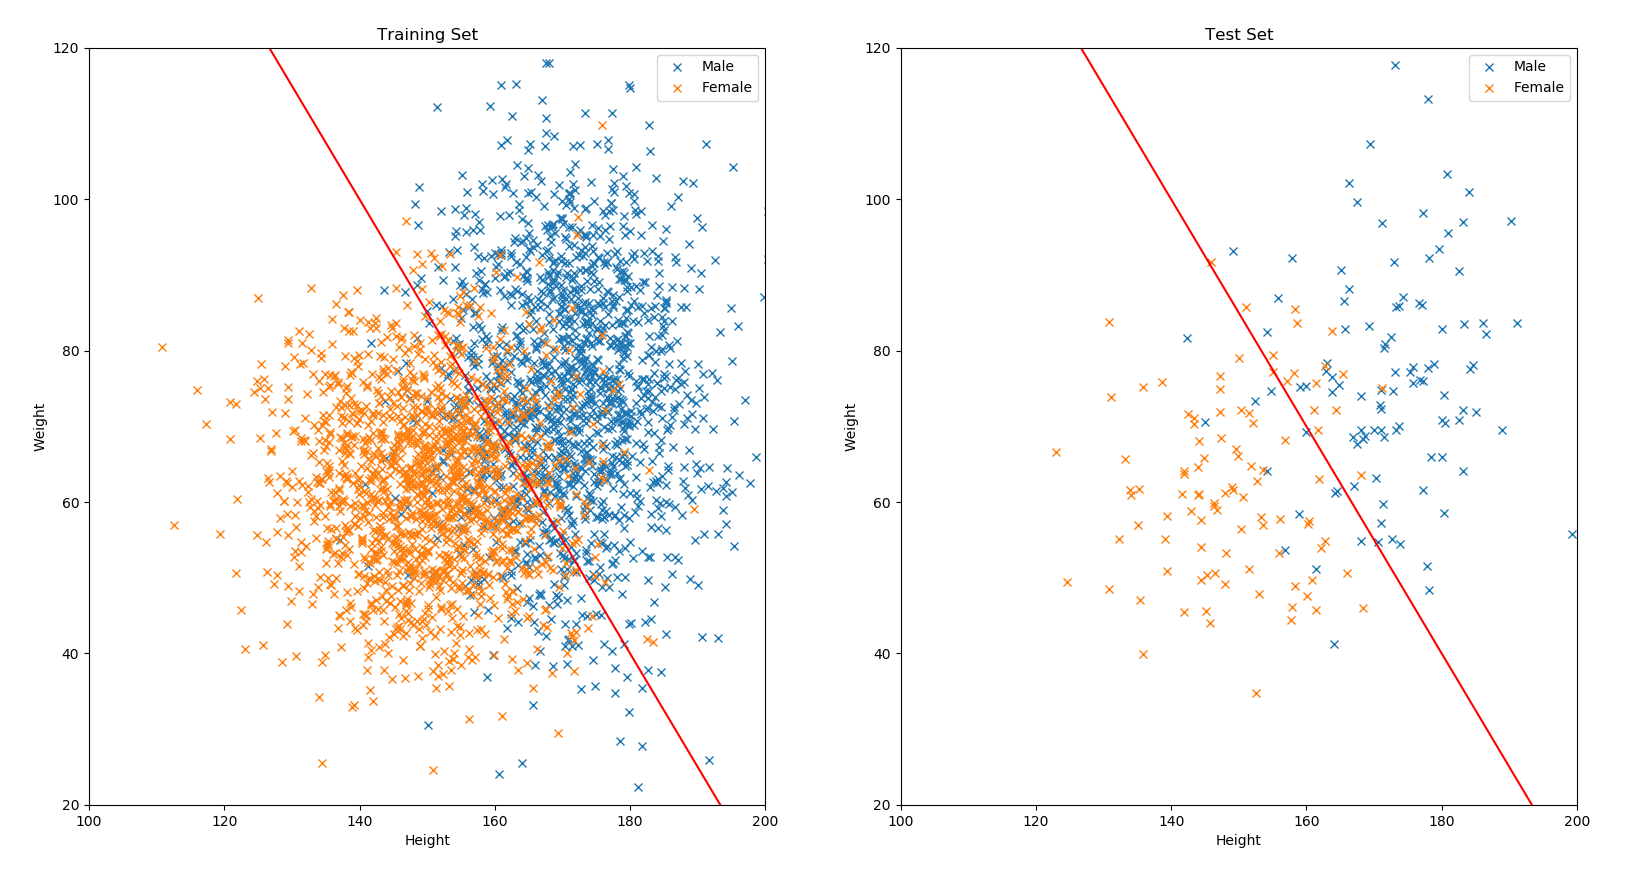
下面的圖片,是使用前述的公開資料集當中的特徵,以及切分好的訓練集和測試集進行繪製。圖片上的線是依據訓練資料的大致邊界,用人工隨便切一刀的線性分類器 y = -1.5 * x + 310,並期望女性資料位在線的左邊,男性資料位在線的右邊,如果你看到有相反的狀況,就代表你發現了這個分類器的分類錯誤:
The figure below is plotted using the features from the aforementioned public dataset, along with the split training set and test set. The line in the figure is a linear classifier, y = -1.5 * x + 310, drawn roughly by hand based on the general boundary of the training data. It is expected that female data points lie to the left of the line, and male data points lie to the right. If you see the opposite situation, that means you have found a classification error made by this classifier:
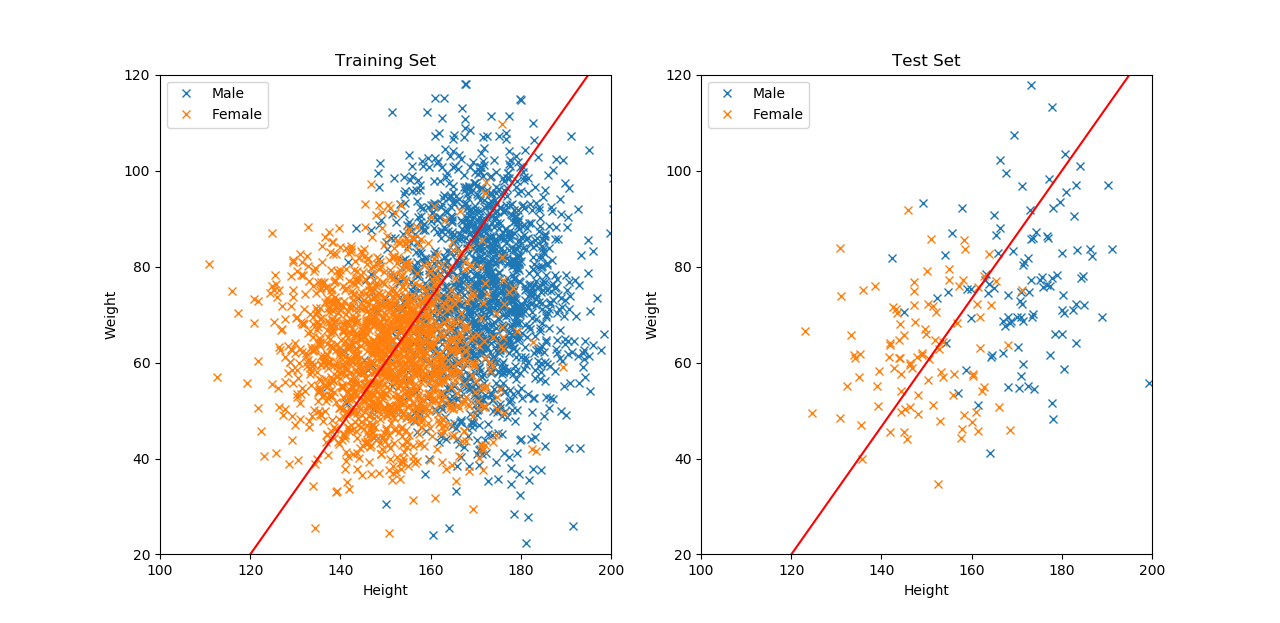
另外,上述範例的問題,因為是分辨不同的種類,所以稱為分類問題;而如果你希望預測的目標是連續的數字,例如從身高預測體重,則稱為回歸問題。下圖是依據訓練資料的大致趨勢,用人工隨意畫出一條回歸線 y = 4 / 3 * x - 140,並期望所有資料點都盡可能地靠近這條線;而資料點與線之間的距離,就是回歸的誤差:
In addition, the problem in the example above is called a classification problem, because it involves distinguishing between different categories. On the other hand, if the target you want to predict is a continuous number, such as predicting weight from height, it is called a regression problem. The figure below shows a regression line, y = 4 / 3 * x - 140, drawn roughly by hand based on the general trend of the training data, where all data points are expected to be as close to the line as possible. The distance between each data point and the line is the regression error:
當你基於訓練資料完成了一個模型(前述範例都是人工切的,後面才會介紹如何讓機器去學)以後,就需要進行效果評估,也就是對它在測試集上的效果打分數。以分類問題來說,單純去計算答對的比率是最常見的評估方式,稱為準確度(accuracy);就前述範例的分類部分來說,訓練集和測試集的準確度分別是 85.1333% 以及 85.8537%。而對於回歸問題,可以用 mean absolute error (MAE)或 mean square error (MSE) 來評量,也就是把每筆資料的答案,跟預測結果計算差距的絕對值或平方,再平均起來即可。就前述範例的回歸部分來說,訓練集和測試集的 MAE 分別是 19.1502 kg 以及 16.4234 kg。
Once you have built a model based on the training data (the examples above were all drawn by hand; later sections will introduce how to let machines learn this), you need to perform performance evaluation, that is, scoring how well it performs on the test set. For classification problems, simply calculating the ratio of correct answers is the most common evaluation method, called accuracy. For the classification part of the example above, the accuracy on the training set and the test set is 85.1333% and 85.8537%, respectively. For regression problems, mean absolute error (MAE) or mean square error (MSE) can be used for evaluation, which involves calculating the absolute value or the square of the difference between the answer and the prediction for each data point, then taking the average. For the regression part of the example above, the MAE on the training set and the test set is 19.1502 kg and 16.4234 kg, respectively.
下面的程式是讀取資料的範例,請各位試著自己接著完成畫圖與效果評估的部分:
The code below is an example of reading in the data. Please try to complete the parts for plotting and performance evaluation on your own:
import numpy as np


def read_file(path):
    with open(path, 'r') as fin:
        cnt = fin.read().splitlines()[1:]

    male_all = []
    female_all = []
    for line in cnt:
        arr = line.split(',')
        if arr[-1] == 'Male':
            male_all.append([float(arr[0]), float(arr[1])])
        else:
            female_all.append([float(arr[0]), float(arr[1])])

    return np.array(male_all), np.array(female_all)


def f_cla(x):
    return -1.5 * x + 310


def f_reg(x):
    return 4 / 3 * x - 140


male_tr, female_tr = read_file('Training set.csv')
male_te, female_te = read_file('Test set.csv')
在上述範例中,如果你把 numpy array 的 shape 印出來,可以發現它們都各自是一個二維矩陣,其中每個 row 是一筆 sample(於此例中為一個人),而每個 column 是一種 feature(於此例中為身高或體重),這是一般表格式資料的慣用形式,若你的資料是影像或聲音等等,可能還會多出通道、時間等不同的維度格式。
In the example above, if you print out the shape of the numpy arrays, you can see that each of them is a two-dimensional matrix, where each row is one sample (in this case, one person), and each column is one feature (in this case, height or weight). This is the common format for tabular data in general. If your data is something like images or audio, there may be additional dimensions such as channels or time.
此外,需要注意的是,視覺化不僅僅是為了展示資料內容,更是檢查資料品質的直接途徑,因為我們可以很容易的觀察不同類別的資料,是否在特徵空間中有足夠的區分度。如果你在圖上看到兩類資料幾乎疊合、混成一團,這代表從目前的特徵維度來看,它們在本質上是「不可分」的。在這種情況下,即便你套用了再複雜的模型,結果依然不會好,這就是典型的 Garbage In, Garbage Out。
In addition, it is important to note that visualization is not only for showing the content of the data, but also a direct way to check data quality, because it lets us easily observe whether different classes of data are sufficiently distinguishable in the feature space. If you see two classes of data almost overlapping and mixed together in the plot, this means that, based on the current feature dimensions, they are essentially "inseparable." In this case, even if you apply a very complex model, the results will still not be good. This is the classic case of Garbage In, Garbage Out.